Troubleshooting Asset Scan Ingest
Messages don't appear in the MQTT test client
If you subscribe to dt/+/asset_scan in the IoT Core MQTT test client and see nothing from a normally operating device, this is expected. Devices publish via Basic Ingest, which uses a different topic prefix than standard MQTT:
| Publish method | Topic | Routed through MQTT broker |
|---|---|---|
| Standard MQTT | dt/{MPBID}/asset_scan | Yes |
| Basic Ingest | $aws/rules/dt_asset_scan_ingest/dt/{MPBID}/asset_scan | No |
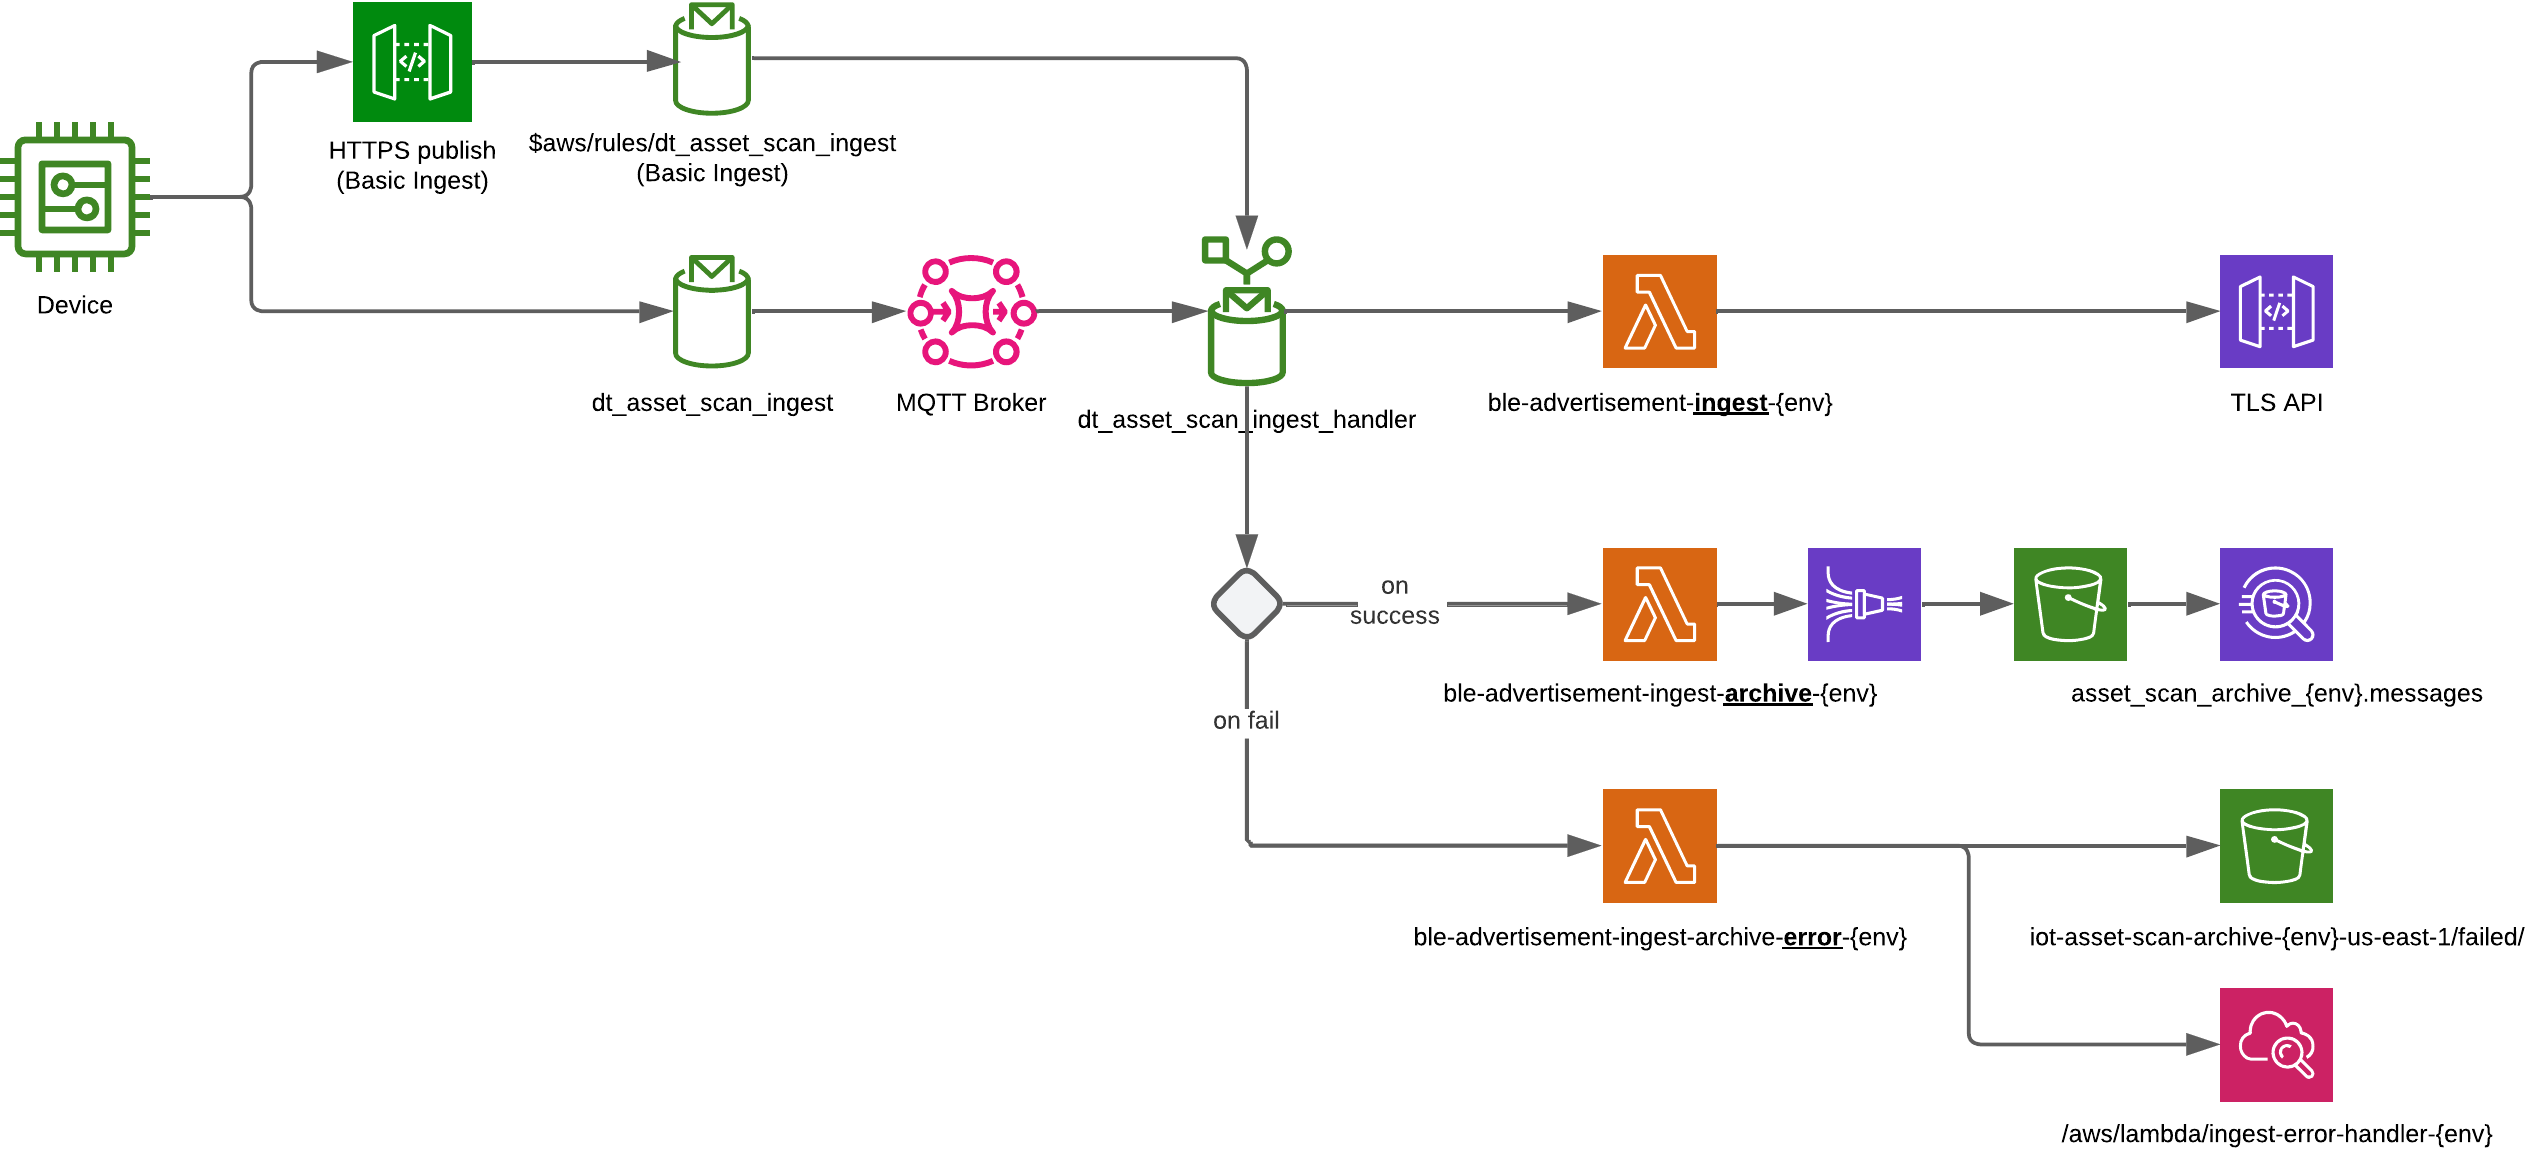
Basic Ingest routes directly to the rule engine and bypasses the MQTT broker entirely. The message is never published to the broker topic, so broker subscriptions never receive it. This is intentional (it avoids the per-message broker fee), but it means the test client is not useful for observing raw device traffic.
To confirm a device is reaching the platform at all, check CloudWatch Logs → log group AWSIoTLogsV2 and filter by the device's MPBID or topic.
Where to look for failures
There are five places to investigate when something goes wrong:
| Where in AWS | Source | What you can see | Links |
|---|---|---|---|
| CloudWatch Logs | AWSIoTLogsV2 | IoT rule execution events, error messages, trace IDs. No raw payload. | Test / Prod |
| CloudWatch Logs | /aws/lambda/ble-advertisement-ingest-{test|prod}, /aws/lambda/ingest-archive-forwarder-{test|prod} | Full Lambda invocation logs including any errors thrown by application code. | Test / Prod |
| CloudWatch Logs | /aws/lambda/ingest-error-handler-{test|prod} | Invocation logs for the error-handler Lambda itself — useful if a failure was expected in failed/ but never showed up (e.g. the handler couldn't write to S3). | Test / Prod |
| S3 | iot-asset-scan-archive-{test|prod}-us-east-1/failed/ | Every failed message: exact raw device payload (.bin) plus the IoT error document (.json) naming which action failed and why. Written by the ingest-error-handler Lambda within seconds of the failure. | Test / Prod |
| Athena | asset_scan_archive_{test|prod}.messages | The raw payload as the archive Lambda received it, queryable by MPBID, topic, or time range. Only populated if the archive Lambda succeeded. | Test / Prod |
Dataflow architecture overview
Inspecting a failed message payload
When any rule action fails (e.g. a malformed payload is rejected by the Lambda invoke API, which requires JSON request bodies), IoT invokes the ingest-error-handler Lambda as the rule's error action. The handler writes two objects to the archive bucket, keyed by date, timestamp, client ID, and a UUID:
failed/event_date=2026-07-17/1752782918000_0288000163_9f5a8a75-....bin   ← exact raw bytes the device sent
failed/event_date=2026-07-17/1752782918000_0288000163_9f5a8a75-....json  ← IoT error document (which action failed and why)
To inspect a failure:
-
Open the bucket's
failed/prefix (Test / Prod), or list from the CLI:aws s3 ls s3://iot-asset-scan-archive-<test|prod>-us-east-1/failed/event_date=2026-07-17/ -
Download the
.jsonerror document to see which action failed and the error message; download the.binfor the exact payload bytes.
The RuleActionFailure metric (IoT/AssetScanManagement namespace) counts every capture and drives the asset-scan-ingest-failures-{stage} alarm; a native AWS/IoT Failure alarm on the rule backs it up.
Failures are now captured in S3 as soon as they happen, so there's no need to be subscribed at the moment of failure. If you don't see an expected object under failed/, check the ingest-error-handler Lambda's own logs (above) and AWSIoTLogsV2 for the error details.
Before July 2026, failures were republished to the MQTT topic errors/dt_asset_scan_ingest for live inspection in the MQTT test client. That topic no longer exists: messages over 128KB could neither be delivered to the test client (PAYLOAD_LIMIT_EXCEEDED) nor processed by the metrics rule (InvalidRulePayloadCombination) — and a republish error action made IoT drop >128KB messages before any action ran, since only Lambda, HTTP, Kinesis, and SQS actions may receive payloads over 128KB.